Introduction
At some point during a happy hour at work, a few drinks in to be sure, someone mentioned that they had heard that it is not possible to tell the difference between red and white wine if they are both served at room temperature. “Bullshit!”, someone probably said. “There’s tannins and shit.” So, being the bright, drunk, ambitious, scientists that we are, we set forth to investigate this and many other questions. Really, it was just an excuse for a bunch of people to get together on a Saturday and drink a bunch of wine.
Method
This experiment was a series of blinded tests. Each guesser was given a blindfold (party time!) and were not allowed so see what they were drinking. Each guesser was given two samples of wine. The types of wine in each pair were randomly selected, so any given pair could be comprised of a red and a white, two reds, or two whites. The guesser would then taste the wines and try to determine what type of wine they were drinking. They were also asked to rate the wines. The test was then repeated 10 times (for group A) and 11 times for (group B).
Results
Question 1
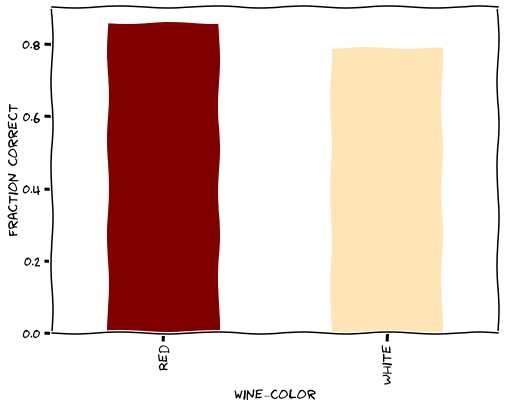
The simplest analysis that can be done is to figure out the overall accuracy of the guesser when determining the type of wine they were tasting, regardless of what type each sample was paired with. Some of the tests included Rosé, but those have been excluded in this portion of the analysis as the tasters were not aware that this was a possible choice.
Overall, 82.9% of wines were identified correctly.
Broken down by type, guessers correctly identified red wine 85.5% of the time, and white wine 78.9% of the time.

Question 2
A different question to ask is, given a pair of red and white wines, ignoring what order they were served in, how many times were both wines identified correctly?
When the two wines in a test were different, they were both guessed correctly 73.2% of the time.
Question 3
Next we look at the results taking into account the different permutations. The table below shows accuracy of each sample within a given permutation.
| First | Second | N samples | |
|---|---|---|---|
| R->W | 82.5 | 82.5 | 40 |
| W->R | 77.7778 | 91.6667 | 72 |
| R->R | 75 | 90 | 40 |
| W->W | 75 | 75 | 8 |
Question 4
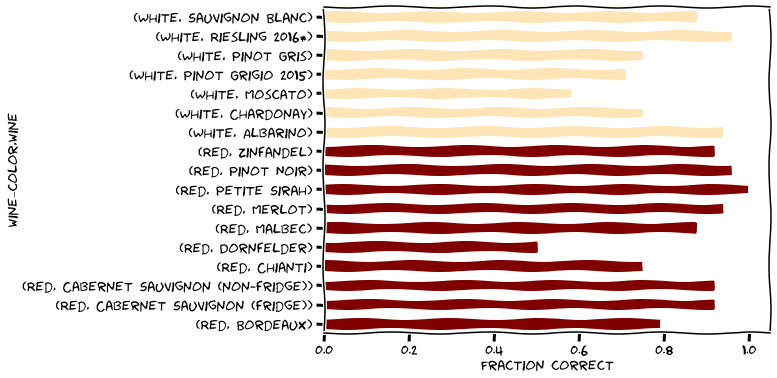
Here we determine the accuracy of the guessers broken down by wine type and brand.

Question 5
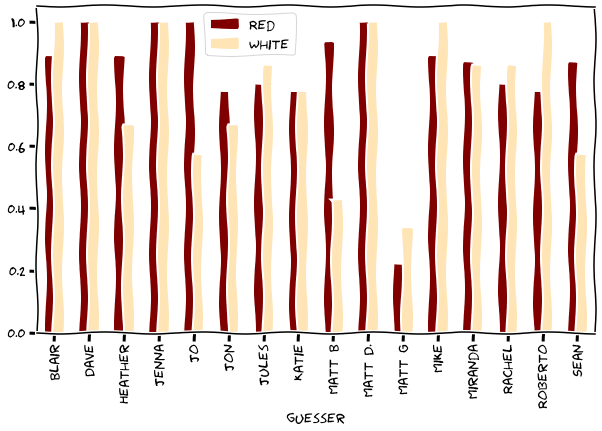
This plot shows the accuracy of each guesser, broken down by wine type.
