Introduction
Intro
Method
Method
Results
Question 1
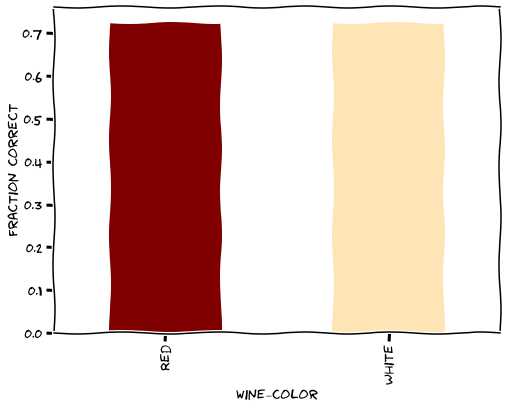
Overall, 72.4% of wines were identified correctly.
Broken down by type, guessers correctly identified red wine 72.3% of the time, and white wine 72.4% of the time.

Question 2
A different question to ask is, given a pair of red and white wines, ignoring what order they were served in, how many times were both wines identified correctly?
When the two wines in a test were different, they were both guessed correctly 53.7% of the time.
Question 3
Next we look at the results taking into account the different permutations. The table below shows accuracy of each sample within a given permutation.
| First | Second | N samples | |
|---|---|---|---|
| R->W | 71.7391 | 69.5652 | 46 |
| W->R | 25 | 75 | 8 |
| R->R | 55.5556 | 51.8519 | 27 |
| W->W | 22.2222 | 66.6667 | 9 |
Question 4
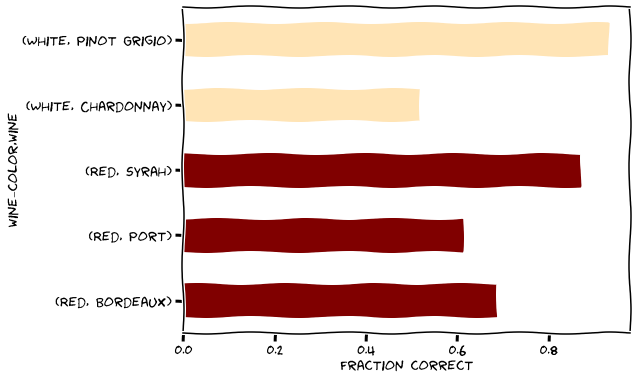
Here we determine the accuracy of the guessers broken down by wine type and brand.

Question 5
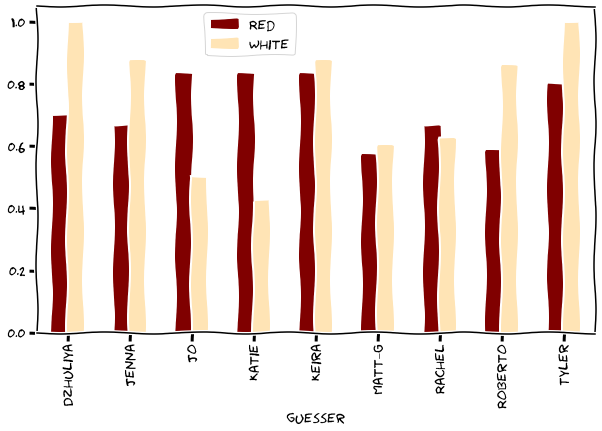
This plot shows the accuracy of each guesser, broken down by wine type.

Wine Ratings
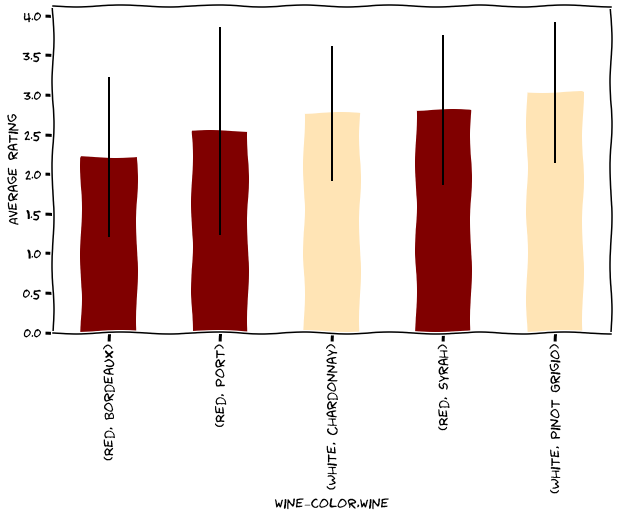
This plot shows the average ratings given to each wine. The error bar represents the standard deviation of the ratings.
