- Date: April 14, 2021
- Location: Murder Cabin
- Participants: Jo, Keira, Matt B., Matt D., Rachel, Roberto
Introduction
How does non-alcoholic beer compare to the real deal? Does it taste the same? Can a person tell the difference? We wanted to find out.
Method
We gathered 6 people to test 20 different beers. The beer samples consisted of 10 alcoholic and 10 non-alhocolic beers of varying styles. Table 1 shows a full listing of the beers used in this experiment, along with their style and alcohol by volume (ABV, as stated on the containers).
| Beer | Style | ABV (%) |
|---|---|---|
| Dogfish Head 60 Min IPA | IPA | 6 |
| Dogfish Head Super 8 Super Gose | Gose | 5.3 |
| Left Hand Brewing Bittersweet Imperial Coffee Milk Stout | Bittersweet Imperial Coffee Milk Stout | 8.9 |
| Left Hand Brewing Peanut Butter Milk Stout | Peanut Butter Milk Stout | 6.2 |
| Left Hand Brewing Raspberry Milk Stout | Raspberry Milk Stout | 5.5 |
| Left Hand Brewing Wheels Gose Round | Gose | 4.4 |
| Maui Brewing Bikini Blonde | Bikini Blonde Lager | 4.8 |
| Salzburger Stiegal | Radler Grapfruit | 2.25 |
| Sweet Baby Jesus | Chocolate Peanute Butter | 6.2 |
| Union Blackwing | Lager | 4.8 |
| Athletic Brewing Upside Down Golden | Golden | 0.5 |
| Bravus Brewing Amber | Amber | 0.5 |
| Bravus Brewing Blonde | Blonde | 0.5 |
| Bravus Brewing IPA | IPA | 0.5 |
| Bravus Brewing Oatmeal Stout | Oatmeal Stout | 0.5 |
| Bravus Brewing Peanut Butter Stout | Peanut Butter Stout | 0.5 |
| Bravus Brewing Raspberry Gose | Raspberry Gose | 0.5 |
| Hairless Dog Black Ale | Black Ale | 0 |
| Partake Stout | Stout | 0.3 |
| Paulaner Munchen | Wiezen-Radler | 0.5 |
Table 1 - List of beers included in this experiment. The first ten beers are alcoholic while the rest are non-alcoholic.
The 6 tasters were split into 2 groups of 3 each. Beers samples 2oz. in size were given to the tasters one at a time, with a break taken after 10 samples. In standard Science Saturday procedure, the tasters were blindfolded during tasting. They were asked three questions about each sample:
- Is the beer alcoholic or non-alcoholic?
- Rate the beer on a scale from 1 to 5 (low to high).
- Provide any comments you might have about the beer.
Results
Identification
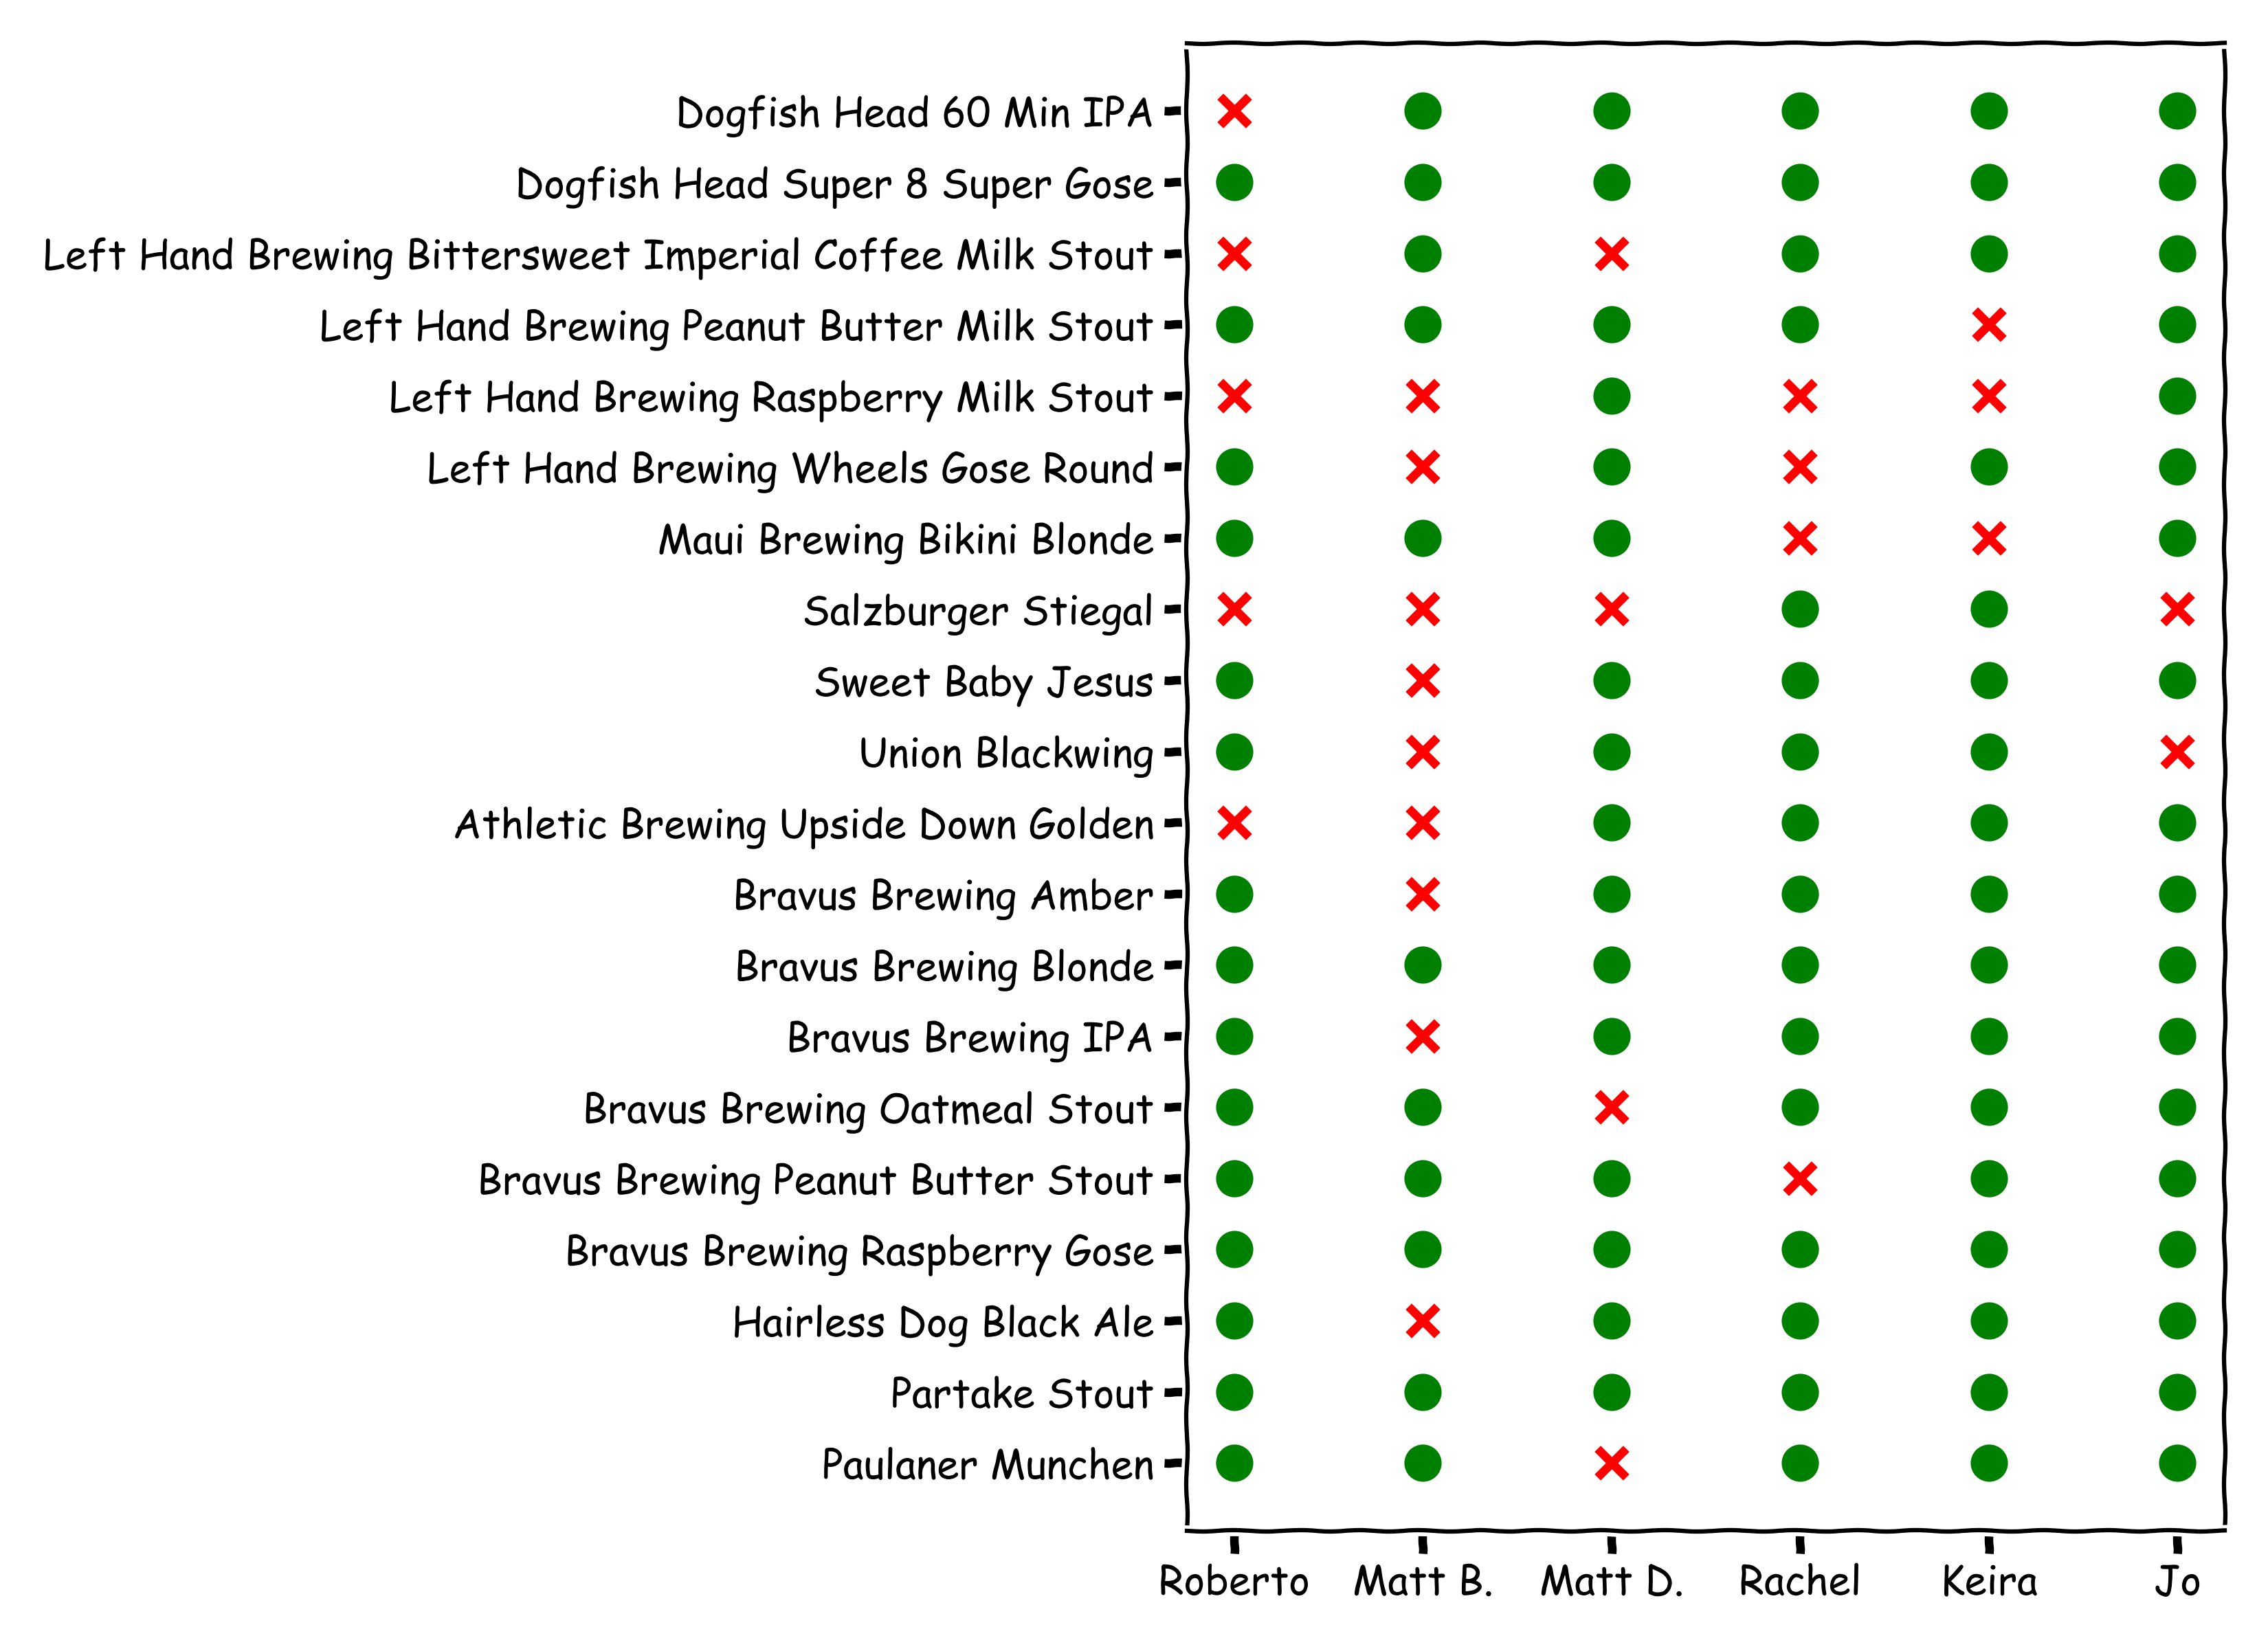
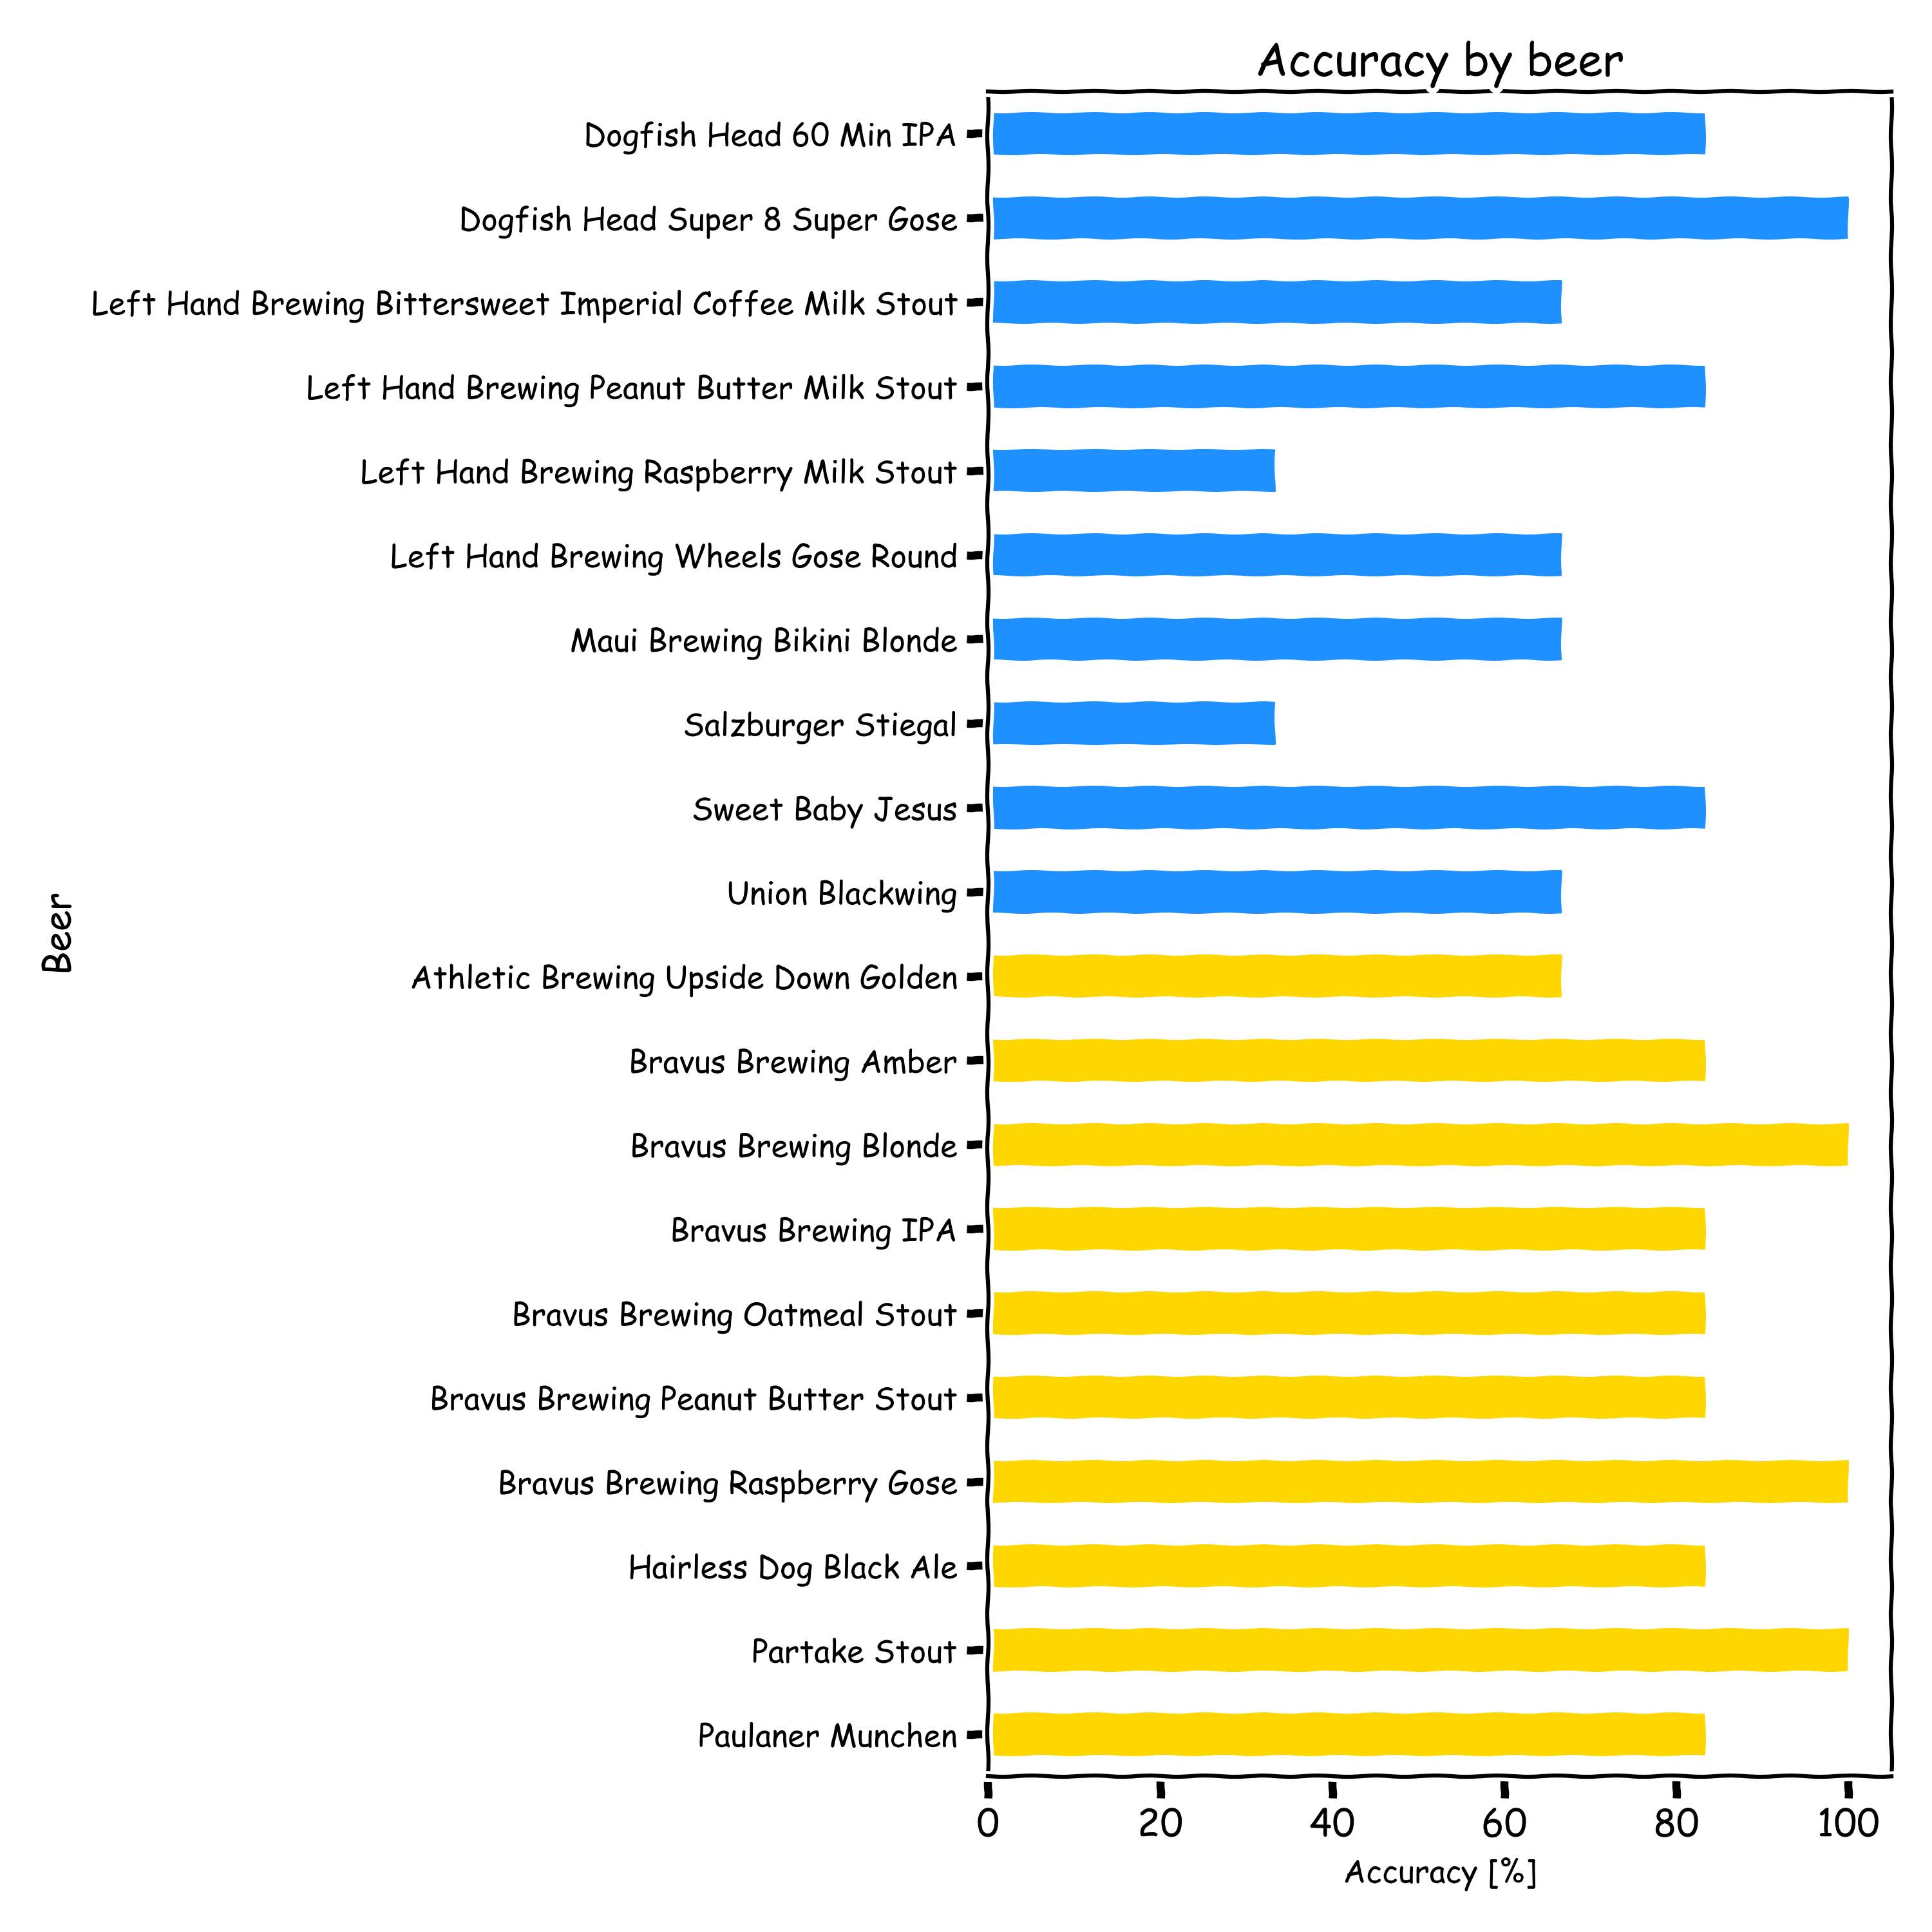
The tasters were able to determine the alcohol content of the sample 77.5% of the time overall. Broken down by type the results were 68.3% for alcoholic and 86.7% for non-alcoholic. The complete results by beer and drinker are presented in the figure below. Green circles stand for correct identification of alcohol content.

The figure below shows percentage of correct identification by beer. Alocolic beers are shown by blue bars, non-alcoholic by yellow bars.

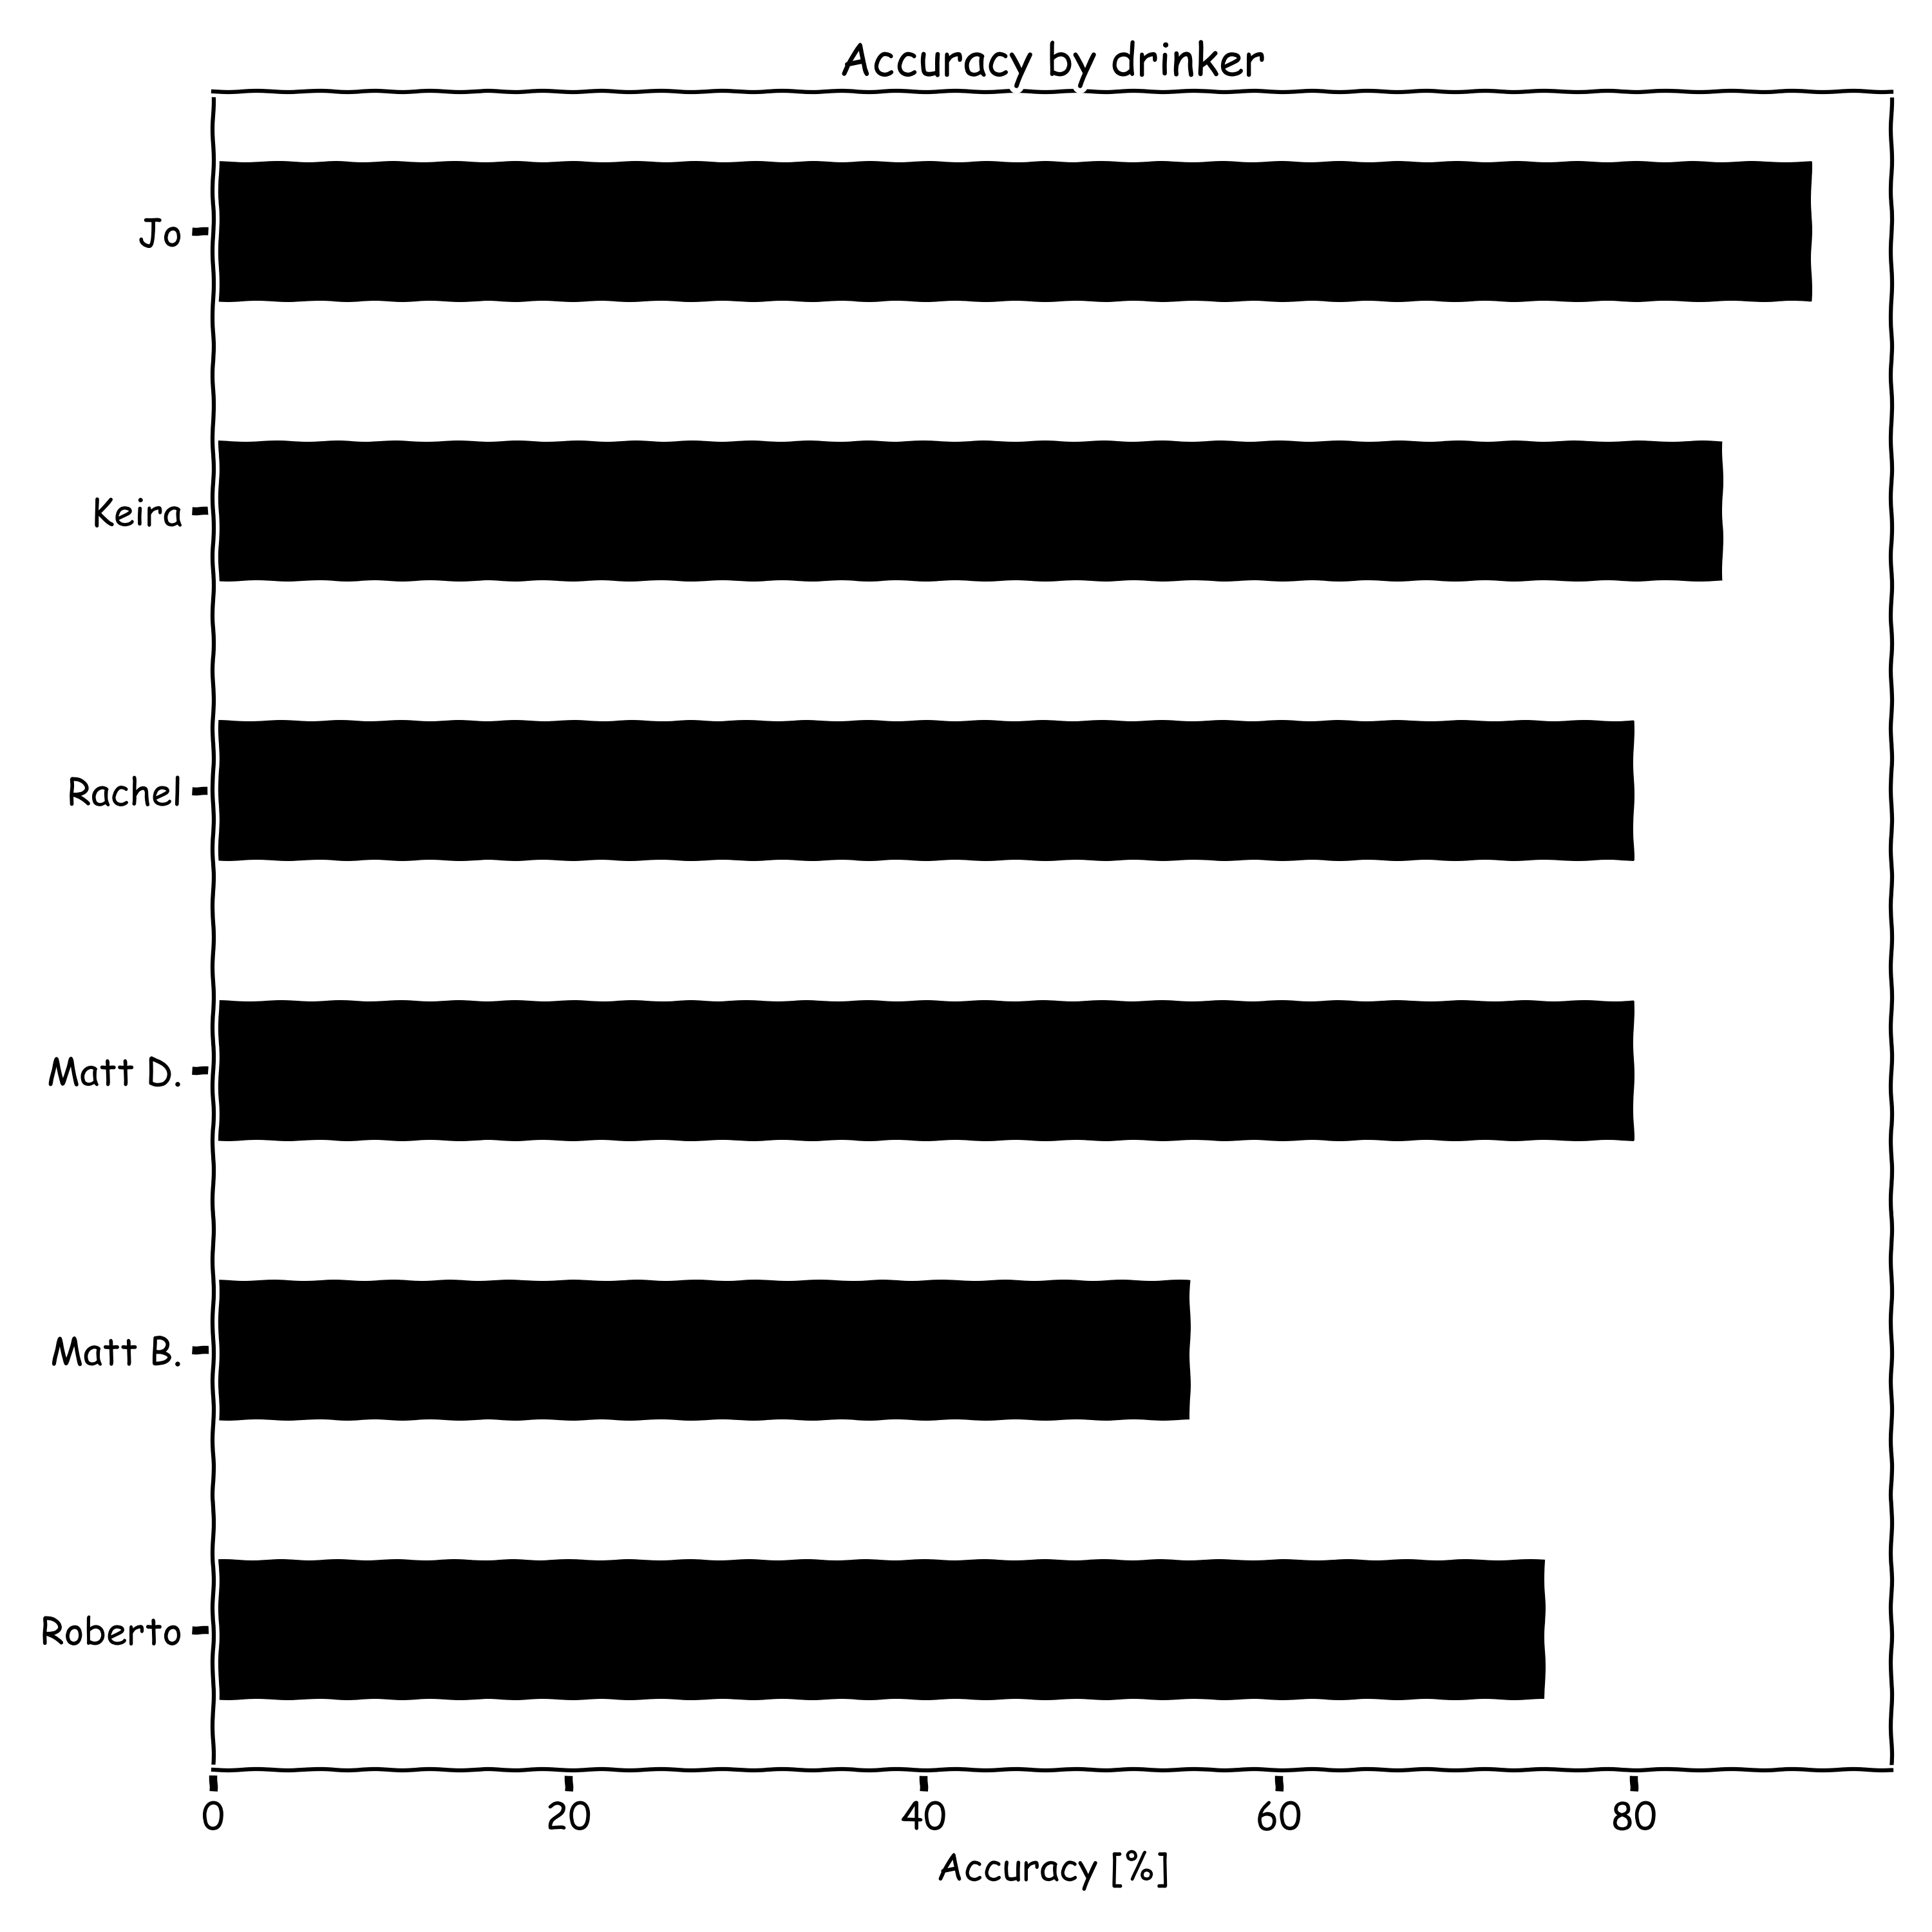
The following figures shows the accuracy of each individual taster.

Ratings
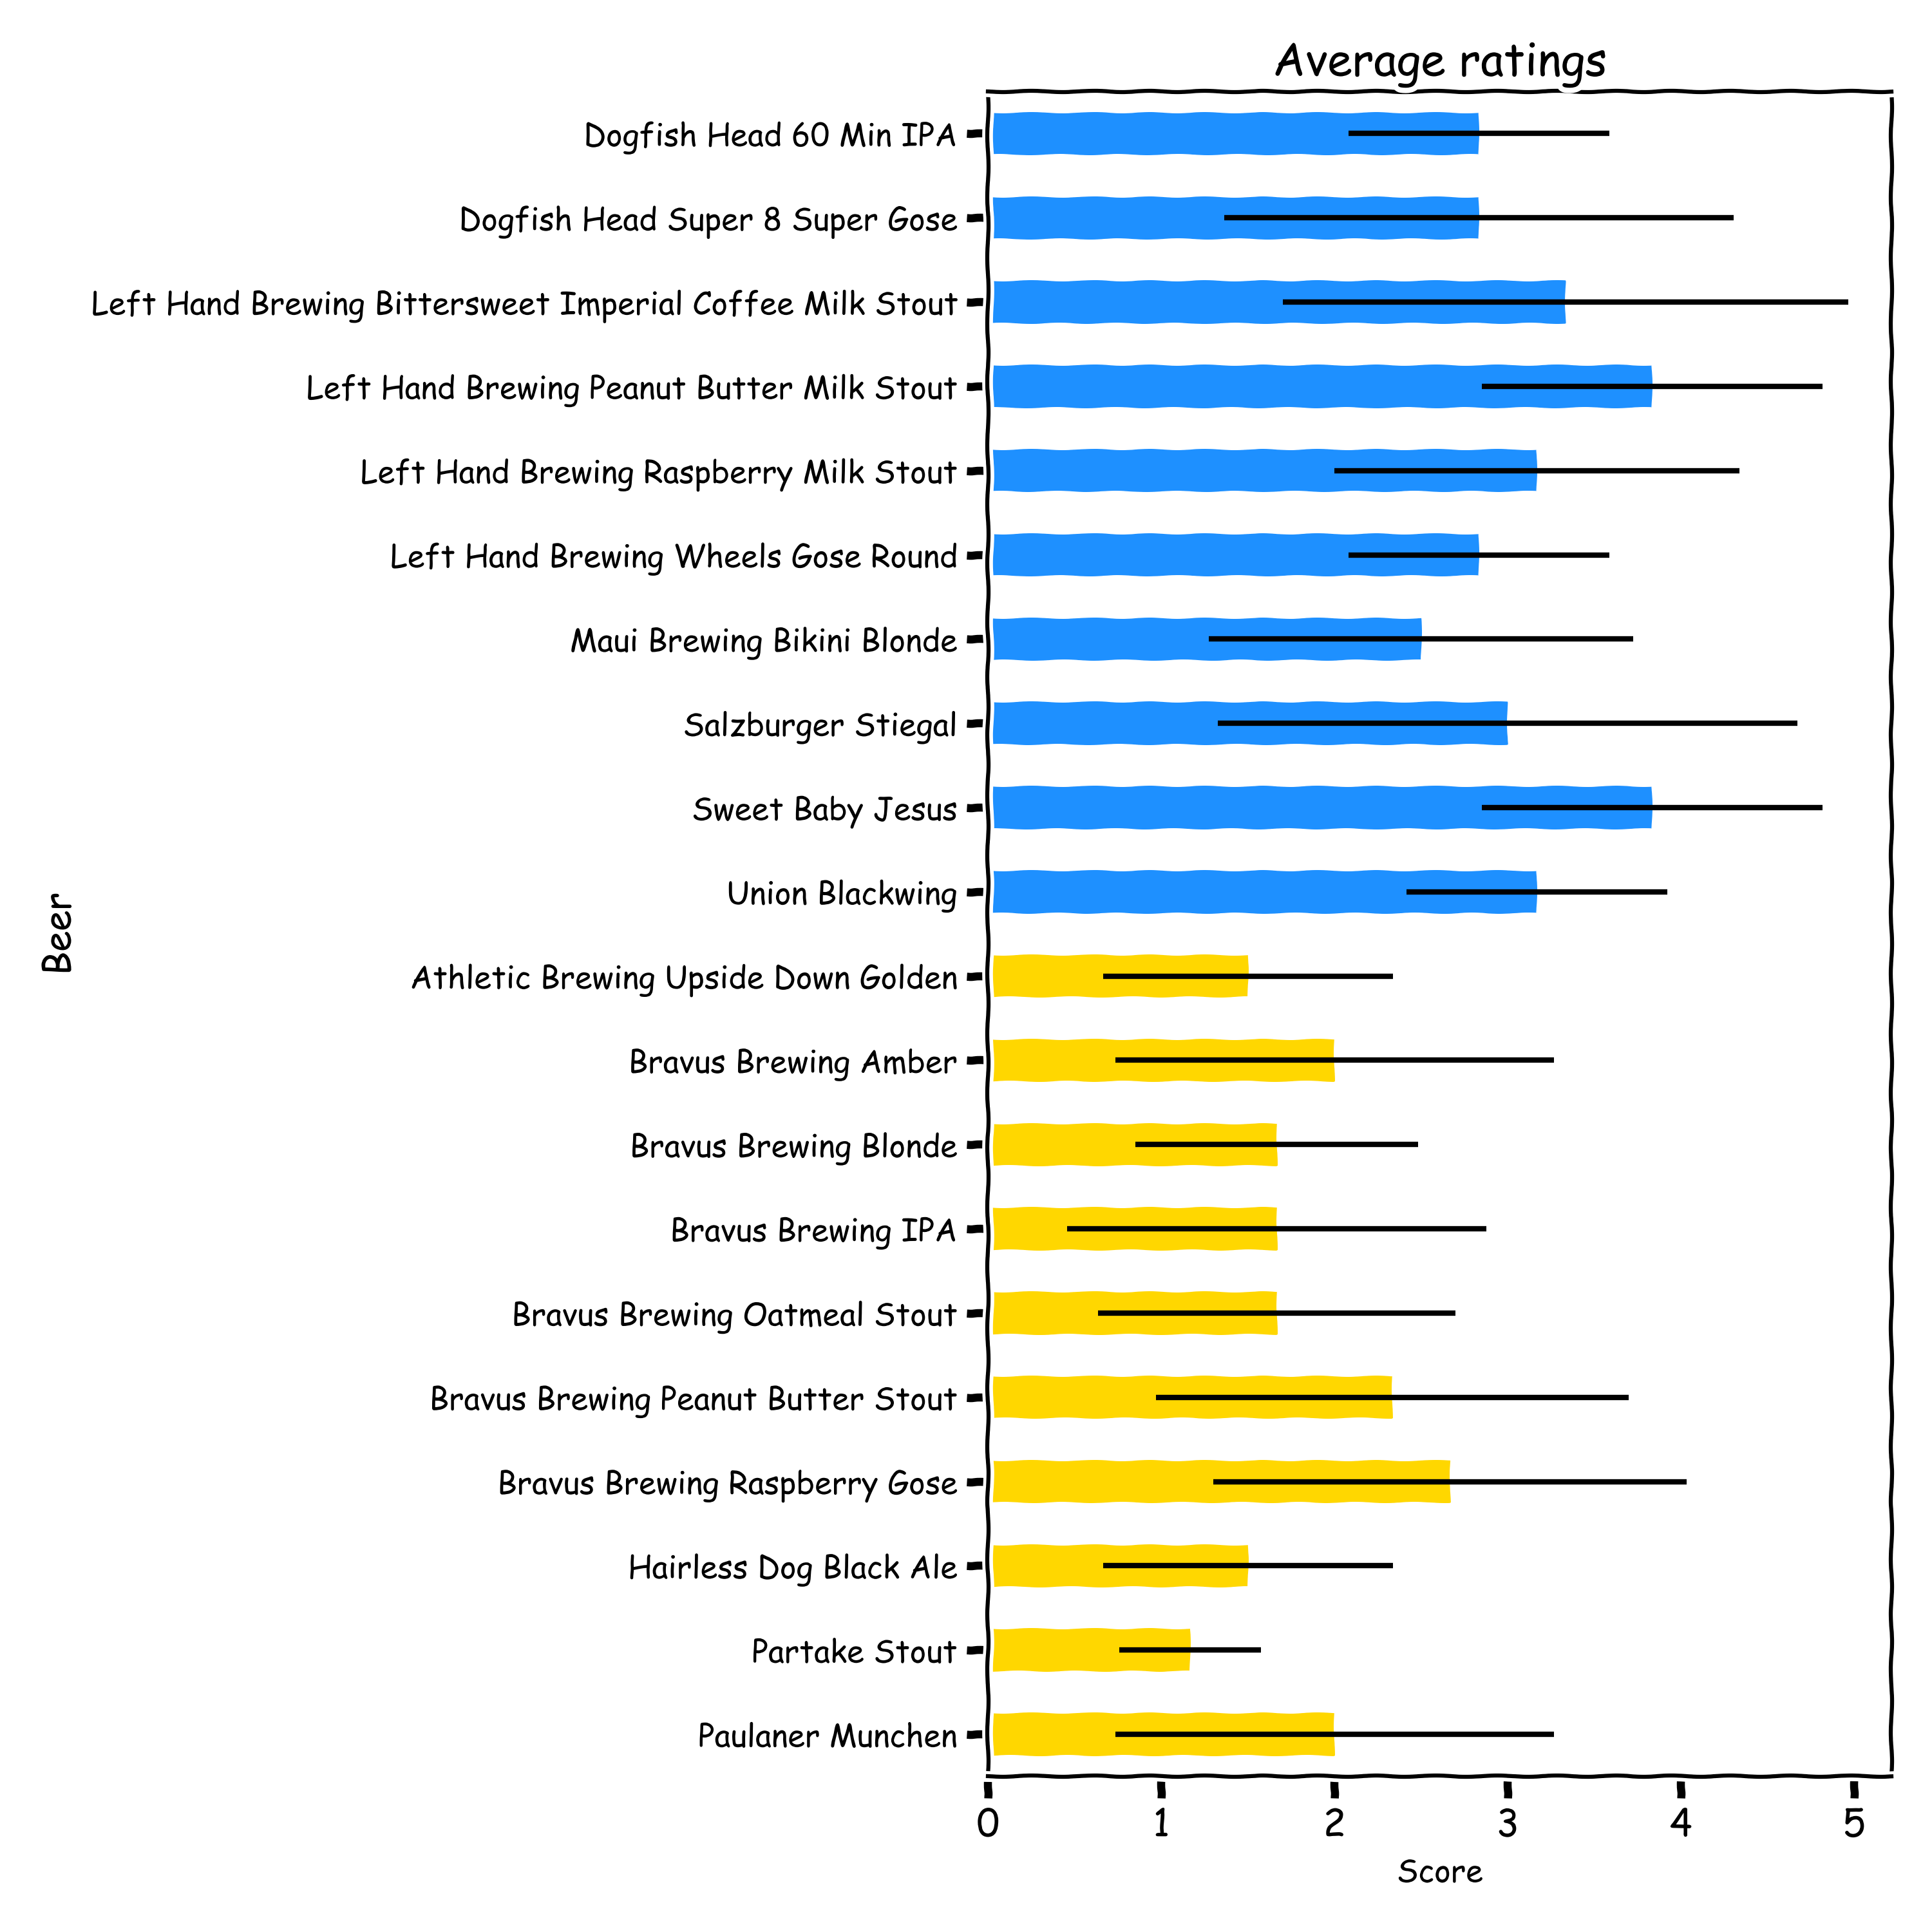
The figure below shows the average scores by beer. The scoring scale was 1 to 5 (low to high). The bars are colored as before; blue bars for alcoholic, yellow for non-alcoholic. Error bars show one standard deviation.
